Complete visibility into your Aeron fleet
Lucern is a purpose-built monitoring tool for Aeron media drivers. Real-time driver health, stream performance, fault detection, and fleet topology — across every node, from a single browser tab.
Built for teams who run mission-critical Aeron installations and need fast, accurate fault diagnosis.
The Challenge
Aeron is a high-performance, low-latency messaging library trusted by trading firms, financial exchanges, and latency-critical systems worldwide. It is fast, reliable, but can be daunting to troubleshoot.
When something goes wrong — a stream falling behind, a sender being flow-controlled, packets being retransmitted — the evidence is buried in counters, error logs, and loss reports spread across multiple nodes. Standard infrastructure monitoring tools see CPU and memory; they do not speak Aeron. Diagnosing a backpressure event or identifying which subscriber is causing a flow-control problem requires deep expertise and manual counter inspection across every node in the fleet.
Lucern exists to close that gap.
One binary. Just add Aeron.
Lucern is a single Go binary with an embedded web UI. Drop it alongside your Aeron media driver. Point it at the Aeron directory. Start it.
- No agents
- No separate database
- No collector infrastructure
- No persistent state to manage
Gossip starts automatically, seeding from the CNC channel data your drivers already produce. Within seconds, other Lucern nodes in the same network appear in the fleet sidebar — no additional configuration required.
Built for all your Teams
Lucern is built to assist experts, and provide expert guidance to everyone else.
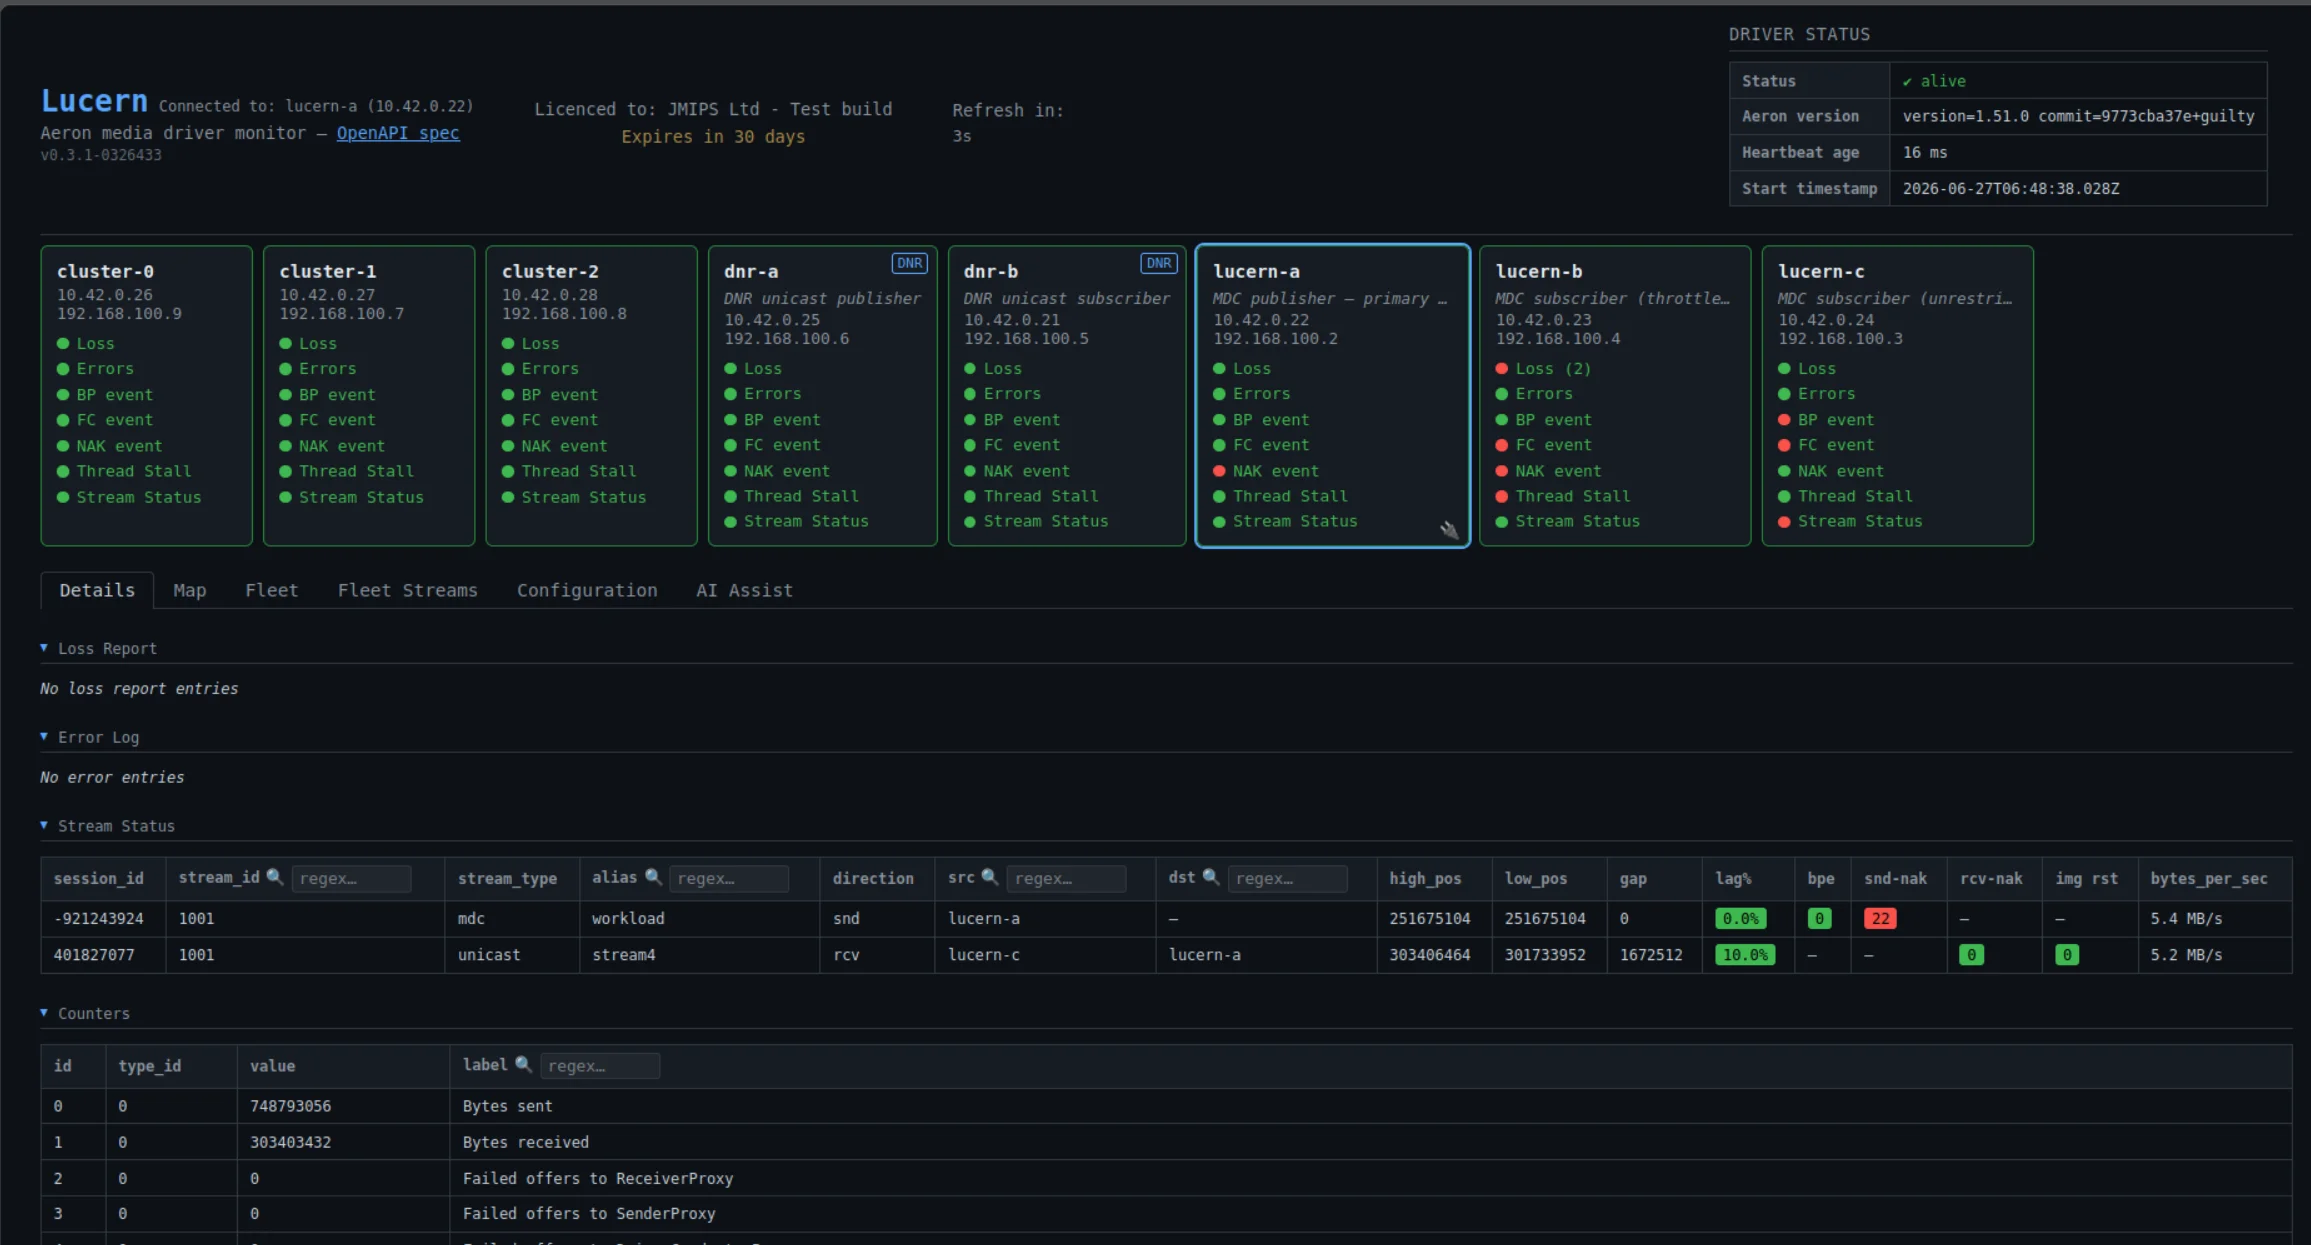
Everything you need, right in front of you
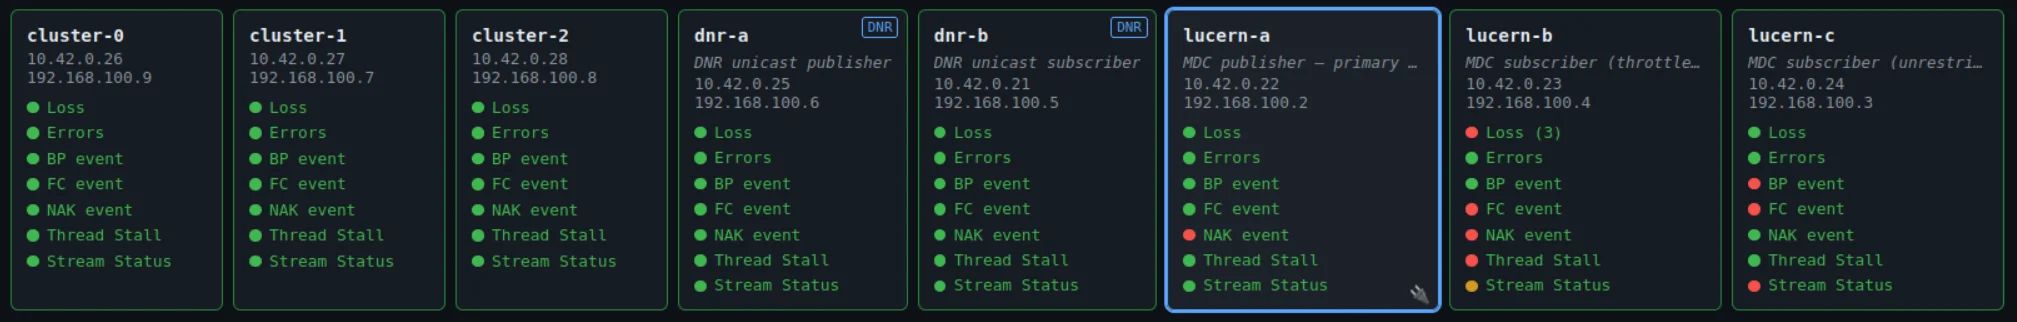
Lucern puts the full raw picture from every node in your fleet onto one screen — no SSH, no manual counter polling, no scripting across hosts.
- All Aeron counters, loss reports, and error logs from every node, easily visible
- Traffic-light indicators surface which nodes have active events — you know where to look before you click
- Counter deltas calculated automatically on every refresh cycle — rate of change, not raw absolute values
- Changed counters highlighted each tick, so drift is visible the moment it happens
- Per-stream sender gap, consumer lag, NAK rates, backpressure events, and image-reset counts — the full picture per stream, per node
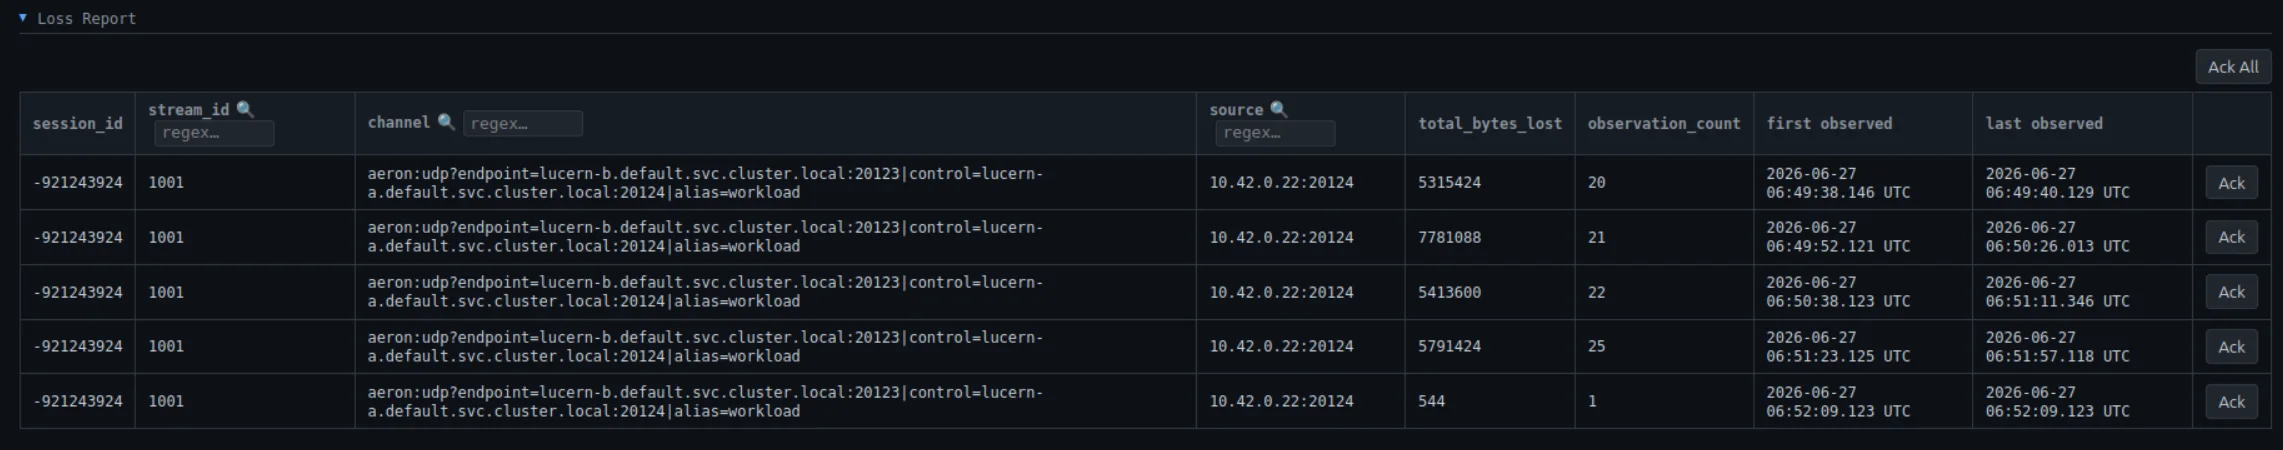
- Regex filtering on counters, streams, and loss entries — find the signal in the noise instantly
- Individually acknowledgeable loss and error entries, so new events always stand out against known noise
Answers without needing Aeron expertise
You don't need to know what a NAK rate is to know something is wrong. Lucern translates Aeron's internals into a clear health picture with enough context to act.
- At-a-glance traffic-light health across the entire fleet — green is good, anything else tells you which node to open
- Every indicator is labelled in plain language with an explanation of what it means and why it matters
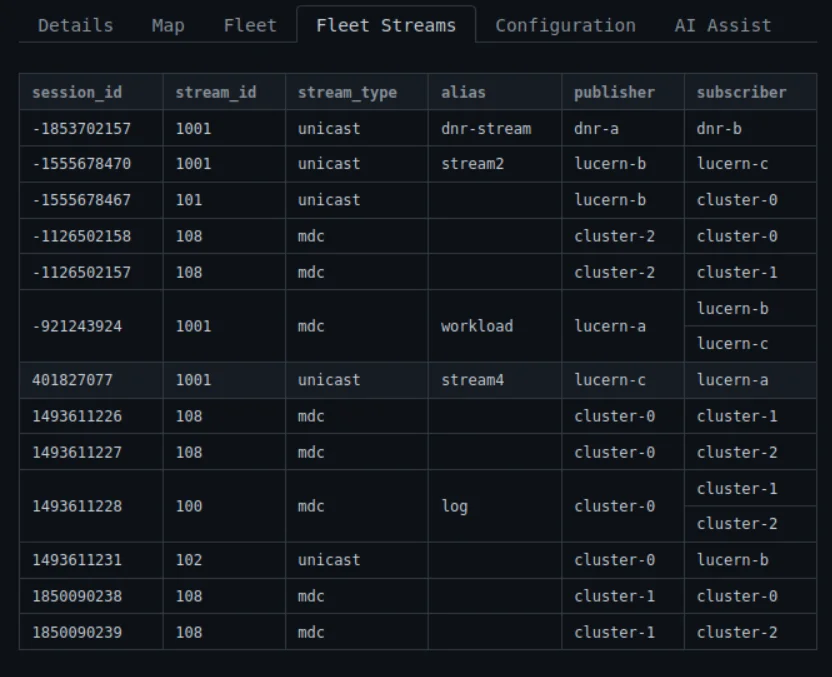
- Topology map shows how data flows between nodes — publishers, subscribers, and the channels connecting them — so you can reason about dependencies and data flows
- Shareable URLs open directly to the same node and view you're looking at — send an expert exactly what you see
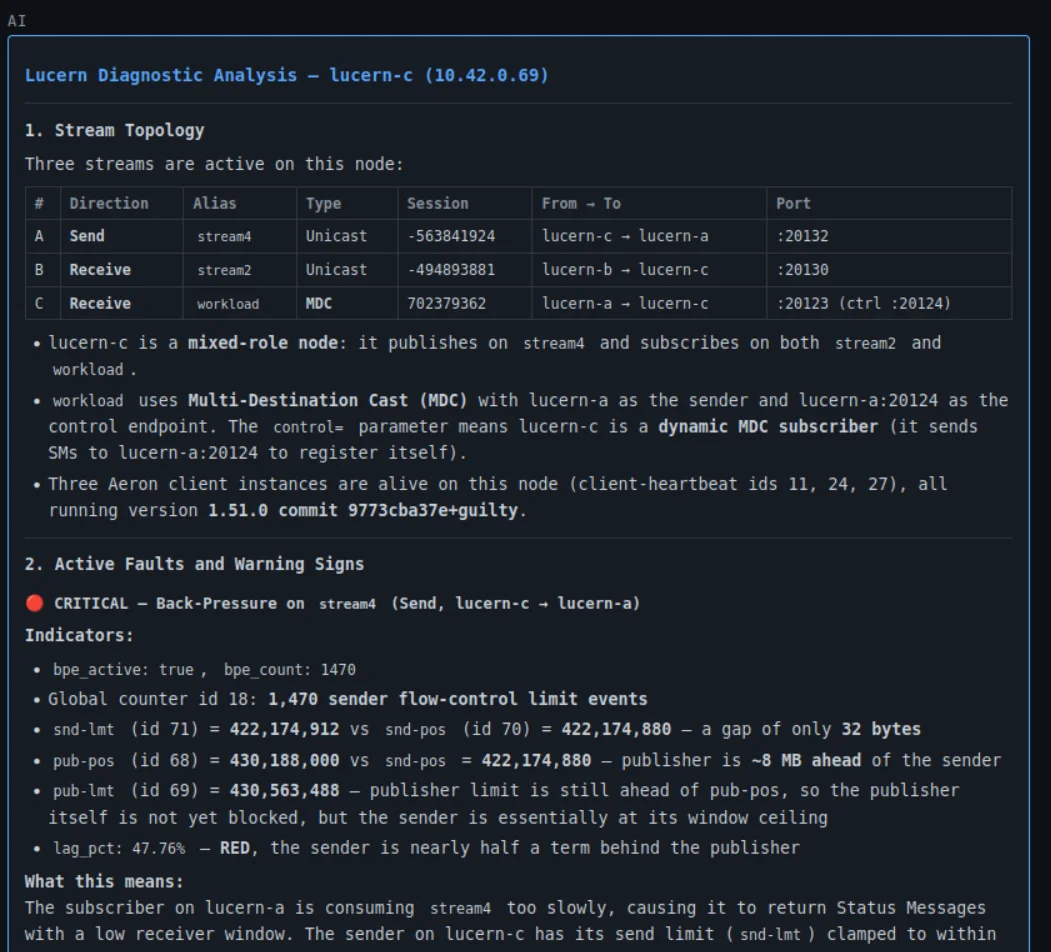
- Integrated AI assistant handoff explains what the counters and events are telling you, in plain English — no Aeron background required to get started
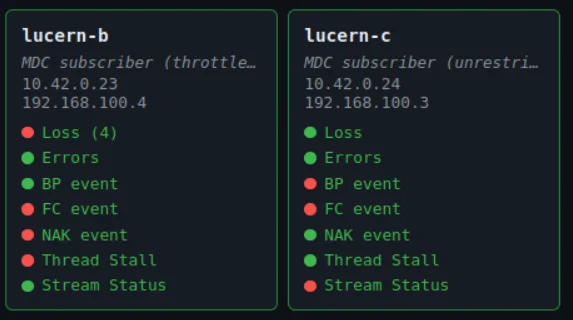
Aeron-native fault detection
Six per-node traffic-light indicators give you an instant at-a-glance health view. Each has a configurable lookback window, so a brief event stays visible long enough to be noticed — not silently cleared by the next poll cycle.
Loss
Packet loss entries in the driver loss report. Any loss on a latency-critical stream warrants immediate attention.
Errors
Media driver error log entries indicating conditions the driver itself flagged as abnormal.
Backpressure
The sender is being flow-control limited. The publisher is writing faster than the downstream system can consume.
Flow Control
Flow control under-runs or over-runs are occurring between publisher and subscriber.
NAK
Retransmission requests are being sent or received, indicating the receiver has detected missing data.
Stream Lag
One or more streams are falling behind their publishers. Configurable warning and critical thresholds fire before recovery becomes impossible.
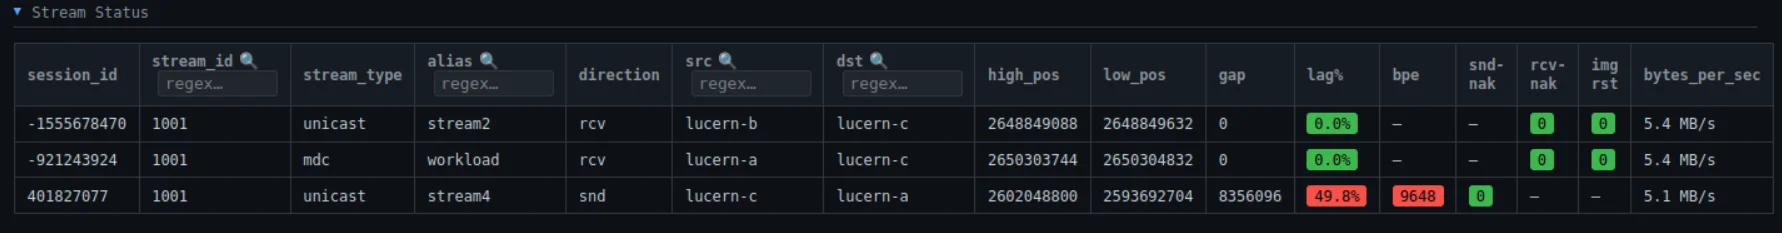
Per-stream diagnostics
Health broken down to individual stream level. For every active send and receive stream:
- Sender gap between publisher position and wire position
- Receiver lag percentage against the configured term buffer
- Live throughput in bytes per second
- Per-stream backpressure events, sender and receiver NAKs, and image-reset activity
- Traffic-light badges that sort active problems to the top
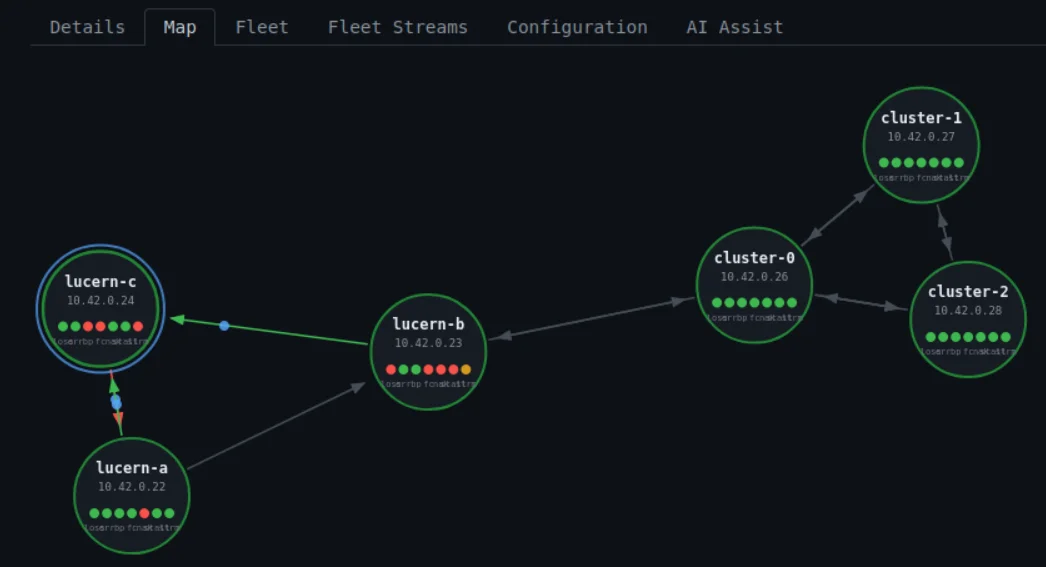
Fleet-wide topology
Lucern nodes discover each other automatically via a gossip protocol seeded from CNC channel data. No service registry required. No central coordinator.
- Interactive topology map — selected node at the centre, peers in orbit
- Send-channel connections drawn as labelled lines
- Traffic-light status visible for every node in the map
- Click any node to switch instantly to its perspective
- Driver liveness and status at a glance
More capabilities
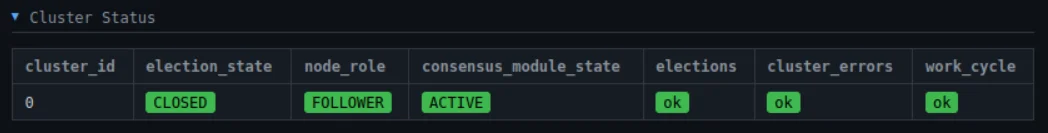
Aeron Cluster support
Surfaces cluster state on each node: election state, node role (Leader, Follower, or Candidate), and consensus module state. Traffic-light warnings fire on elections, cluster errors, or work-cycle threshold breaches.
Acknowledgement system
Loss and error entries are individually acknowledgeable by stable ID. Once acknowledged, excluded from traffic-light counts until a genuinely new event arrives. Acknowledgements reset on restart so no historical backlog silently suppresses a current problem.
Shareable URLs
The selected fleet node and active tab are reflected in the browser URL at all times. Copy the link, share it with a colleague, and they open directly to the same node and view.
AI-assisted debug
An integrated AI assistant can be invoked on any node to help diagnose what the counters and events are telling you — useful when the symptom is clear but the cause is not.
Full REST API
Every piece of data Lucern shows in the UI is also available over a REST API, documented by an OpenAPI 3.0 schema served live from the instance. Integrate with your own dashboards, alerting pipelines, or runbook automation tools using the same data the UI consumes.
Design principles
Aeron-native
Reads the CnC file through the Aeron C library — the same path the driver itself uses. Loss reports and error logs come from the actual files on disk. Nothing is inferred or approximated.
Read-Only Aeron access
Lucern does not and cannot interfere with Aeron, it's engineered specifically to only require Read-Only access to Aeron media driver data.
Fleet-first
Gossip is core to how Lucern works. Every node contributes its local view to a consistent fleet-wide picture, visible from any single node.
Fast, Simple and Lightweight by design
No external data storage required. Counter history is an in-memory ring buffer — no disk writes, no database. Pair with your normal monitoring & alerting system for persistence
Resilient to driver changes
If a media driver restarts or is upgraded, Lucern detects the change on the next tick and updates accordingly. There is no stale state to clear manually.
Configuration is transparent
Every option Lucern supports — lookback windows, lag thresholds,
refresh interval, gossip parameters — is visible at
/api/v1/config on any running instance.
Tested with real faults
Tested by creating real faults on demand and validating Lucern's response across the fleet.
Interested in Lucern?
Contact JMIPS to discuss licensing, deployment, and how Lucern fits your Aeron environment.
Contact JMIPS